Details
Location
Comalcalco, Tabasco, Mexico
Well Type
Onshore J-type, oil and gas
Hole Size
Well A
- 17-1/2 × 12-1/4 × 8-1/2 × 6 in.
Well B
- 12-1/4 × 8-1/2 in.
Casing And Liner Sizes And Types
Well A
- Conductor Casing:
20-in., 129.33-lb/ft X52 - Surface Casing:
13 3/8-in., 54.5-lb/ft J55 - Intermediate Casing:
- 9 5/8-in., 53.5-lb/ft TAC140
- 9 5/8-in., 47-lb/ft P110
- 9 5/8-in., 47-lb/ft TRC95
- Intermediate Liner:
- 7-in., 29-lb/ft P110
- 7-in., 29-lb/ft TRC95
- Contingency Liner:
5-in., 18-lb/ft N80 - Tubingless:
- 3 1/2-in., 12.95-lb/ft P110
- 3 1/2-in., 12.95-lb/ft TRC95
Well B
- Conductor Casing:
13 3/8-in., 54.5-lb/ft J55 - Surface Casing:
9 5/8-in., 36-lb/ft J55 - Production Casing:
- 7-in., 26-lb/ft P110
- 7-in., 26-lb/ft N80
Depth
Well A
- 11,909 ft (3,630 m) MD
- 10,072 ft (3,070 m) TVD
Well B
- 9,843 ft (3,000 m) MD
- 8,668 ft (2,642 m) TVD
Products/Services
×
![]()
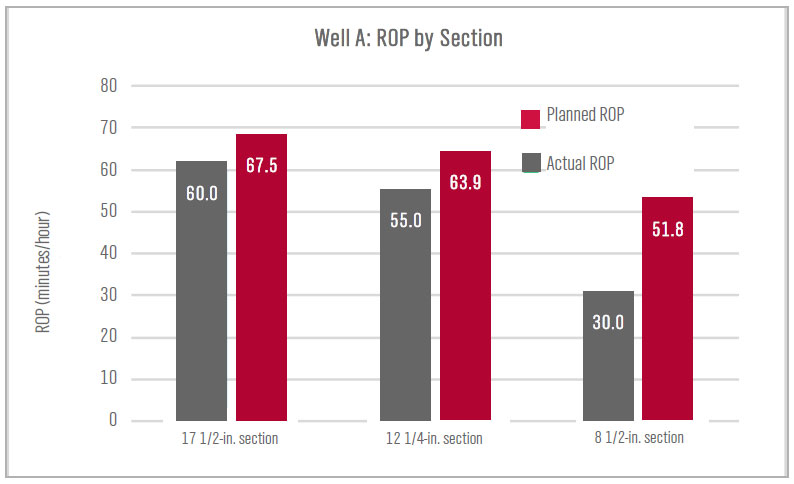
Before operations began in Well A, the drilling program established estimates for rate of penetration (ROP) according to past performance. The above graph shows that the actual ROPs exceeded the planned ROPs in each section.
×
![]()
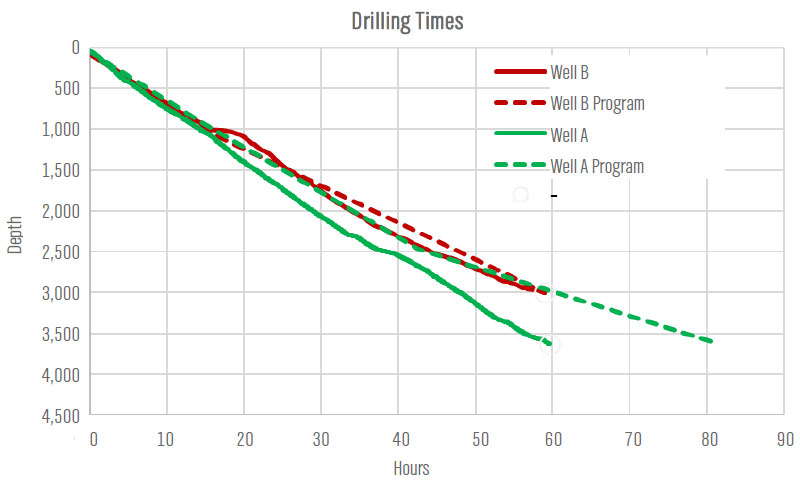
The above graph illustrates drilling times in Well A (green) and Well B (red). Although the drilling program estimated 82 hours of drilling time in Well A, the actual time took 60 hours, which equates to 22 hours saved.