I improved this screen’s performance by 1000% and so can you! (part 1)
May 5, 2015 /
0 comments / in
General
Software Conference
Support
/ by CygNet Blog Admin
Recently, I was asked to assist with a customer support call regarding a poorly performing CygNet Studio screen. Having just participated in Dan Snyder’s CygNet Database Service Diagnostics and Performance Tuning breakout session at this year’s WESC, I felt more than ready to take on this challenge. Surprisingly, the actual diagnostic and remediation process required was much more involved than I expected. My hope is that by describing, over the next several posts, the detailed process I went through to decrease the screen load time from 30 seconds to 3 seconds, you may come to understand the nuanced considerations required to craft and verify the most efficient solution for your particular needs.
Setting the scene
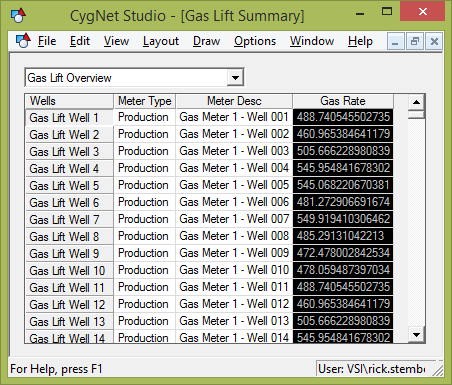
The relevant elements of the customer’s Gas Lift Summary screen below are represented by a very common and straightforward set of CygNet Studio controls.
-image1.png)
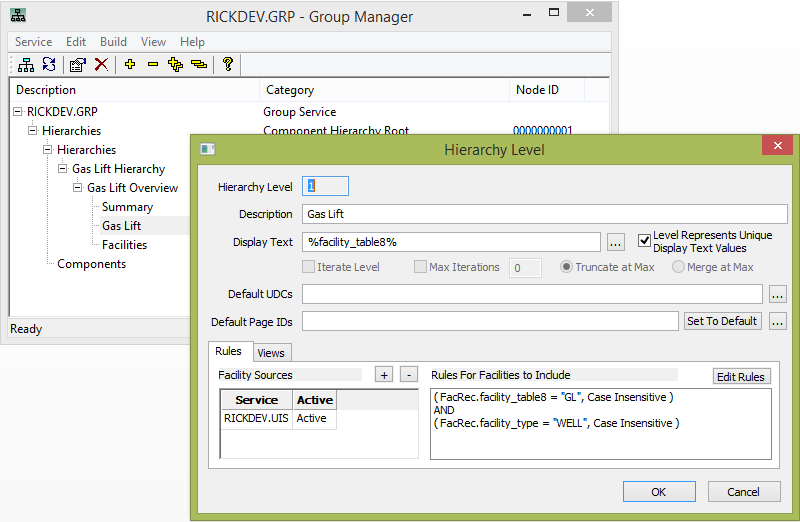
The screen navigation is driven by a Group Navigation Bar pointing to a simple navigation hierarchy representing all wells using gas lift as their artificial lift technology. A facility represents a Gas Lift Well when it has a Facility Type of “WELL” and a Facility Table Attribute 8 of “GL”. The rule-based hierarchy definition in Group Manager used to build the Group Hierarchy is as follows:
-image2.png)
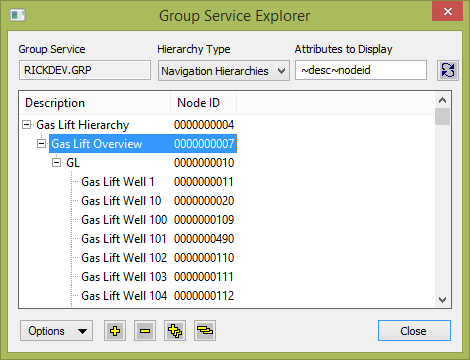
The results of building the Group Hierarchy are shown in the As-Built Hierarchy below.
-image3.png)
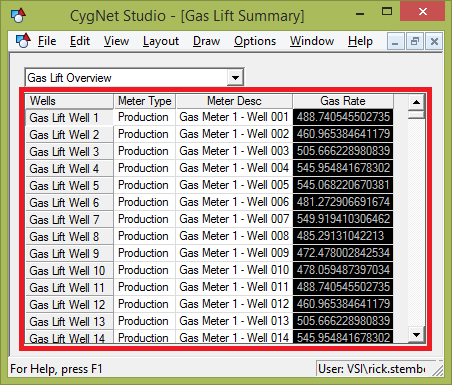
Back to the Gas Lift Summary screen. Beneath the Group Navigation Bar is a Group Grid control configured to display, as grid rows, the 500 Gas Lift Well facilities loaded by the Group Navigation Bar.
-image4.png)
The columns of the Group Grid are configured to display various facility attributes and point values, not from the Gas Lift Wells themselves but, instead, from each Gas Lift Well’s associated Production Gas Meter Run using the Reference Facility feature of the Group Grid.
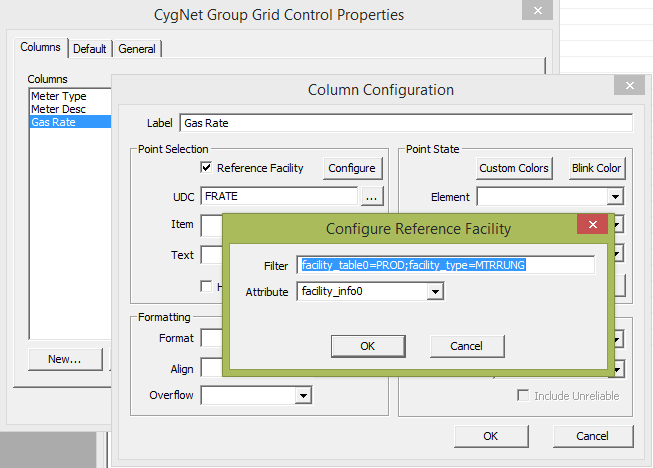-image5.png)
The meaning of the above configuration can be summarized as follows.
For each row in the grid, grab its Gas Lift Well facility tag, for example RICKDEV.UIS::GLWELL001. Then, search the FAC service for another facility (a reference facility) whose Facility Info 0 attribute has a value, in this example, of “RICKDEV.UIS::GLWELL001” as well as a Facility Table 0 attribute value of “PROD” and a Facility Type attribute value of “MTRRUNG.”
The important point here is that the three filtering terms expressed above are ANDed together into a single request for the desired reference facility. If it helps, the following is the equivalent search query expressed in SQL-ish (meaning the syntax is simplified, don’t try to run it, it won’t work).
SELECT ReferenceFacilityTag

FROM    RICKDEV.FAC

WHERE  facility_info0 = ‘RICKDEV.UIS::GLWELL001’ AND

facility_table0 = ‘PROD’ AND

facility_type = ‘MTRRUNG’
As it turns out, in our example system, there are three other facilities that have a Facility Info 0 attribute value of “RICKDEV.UIS::GLWELL001”: two Gas Lift Meters and one Tank.
But, only one of the three facilities meets all the search criteria, the Production Gas Meter facility RICKDEV.UIS::GMTR01-001.
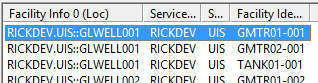-image6.png)
So, in this way, each row of the Group Grid can be configured for the Gas Well facilities but display Meter Type, Meter Desc, and Gas Rate values from the well’s associated Production Gas Lift Meter. I know, pretty slick.
What’s not so slick is that, on the certain customer client machines for which network latency is higher than normal (ping times around 30 millisecond), this simple screen takes nearly 30 seconds to load. What to do, what to do?
Guidelines for diagnosing poor screen performance
The complete subject of “diagnosing poor screen performance” is a long and nuanced discussion but I will touch on some simple techniques that should be generally useful, and then discuss the specific process for diagnosing and remediating our little problem here.
When diagnosing poor screen performance, the first question we should attempt to answer is “Is the time being spent communicating with the CygNet Services (aka CygNet messaging) or is there something funny going on with the screen itself, for example a long-running script or poor performing control?” Based on the fact that the performance problems were only reported on client machines with higher than normal network latencies, coupled with the fact that there is no script on this simple sample screen, it is reasonable to suspect that the time it takes to retrieve data for the screen using CygNet messaging is what is taking so long. However, we should always, always, always validate our assumptions. The biggest time sink of any diagnostics process is heading down a path of investigation based on false assumptions.
When you suspect that CygNet messaging may be the cause of your slow screen performance, you should follow these three guidelines when evaluating this hypothesis.
- Perform your evaluation on the CygNet client machine if at all possible.Evaluating CygNet messaging on a CygNet host can be very difficult since CygNet Services communicate with each other using the same CygNet messages issued by the client applications. Weeding out which messages are being issued by your client application in the complex messaging environment of a CygNet host, although possible, can be very challenging.
- Understand the network latency characteristics between your CygNet client and the CygNet host.CygNet messaging tends to be sensitive to network latency because, although the messages are small and concise, there tends to be many of them sent and each message is affected by latency. If your IT infrastructure rules prevent you from issuing a network ping, run the CygNet utility SvcDiags on your CygNet client machine. SvcDiags will report the round-trip time of CygNet messages from that machine to the various CygNet Services when the auto-update feature is enabled.
- Simplify your client-side environment, typically a CygNet Studio screen, as much as possible.The original customer screen that was experiencing the slow performance was actually part of a much more complex, multiple-tabbed, embedded screen implementation. Creating a brand new screen that contains the minimum set of screen controls and script while still demonstrating the issue typically does not take much time and will help isolate the problem.
Even after following these guidelines, you may find that the time it takes to load your simplified screen is inconsistent. Sometimes it takes a long time, other times it is quite fast. For diagnostic purposes, it is very important that consistent screen load times be achieved before proceeding with our evaluation. The most-likely explanation for this inconsistent behavior is that CygNet Studio and other CygNet applications “cache” much of the retrieved CygNet data to local, temporary files. Once the data is saved locally in this way, CygNet messages are no longer required to retrieve the data and the screens run more quickly. One technique to provide consistent screen load-time behavior is to first close all CygNet client applications on the client machine, open Windows Explorer and type %temp% into the file path edit box, find and delete the folder called CygNetCache and then re-open the CygNet Studio screen. When running CygNet Studio during this diagnostic process, you should run the CStudio.exe application directly and not use a version-managed shortcut since that could affect load-time evaluation. If you perform these steps, your screen’s load times should be consistent.
One more note about the CygNetCache folder. Deleting one’s CygNetCache folder has become a very trendy and over-used action to take when attempting to solve a local screen issue when, in most cases, it is not warranted. You should be very skeptical if someone were to advise that “in order to solve your problem, you should definitely delete your CygNetCache” without a specific diagnostic purpose, such as the one I have outlined above. The same can be said for re-indexing your databases, re-installing your operating system and throwing out your machine and buying a new one. All of these are probably not the best diagnostic steps to take.
Implementing the guidelines
Based on the fact that our sample screen contains two controls, a Group Navigation Bar and a Group Grid Control, one might wonder to what extent each of the controls are contributing to the screen’s slowness. With that in mind, as I was constructing the simplified screen, I first tested the screen with only the Group Navigation Bar present and verified that the screen loaded very quickly (even after deleting the CygNetCache folder). Likewise, when I added the Group Grid Control without the Reference Facility column configuration, the screen also loaded very quickly. It wasn’t until I added the columns with Reference Facility configurations that I observed the screen’s extreme slowness.
New hypothesis: The process of resolving the Reference Facility requests against the Facility Service is the source of the screen’s poor performance.
One technique to perhaps bolster our suspicion is instead of deleting the CygNetCache folder as a means to achieve consistent screen load times, just modify a single Facility Service record and see if consistent screen load times are still achieved. The reason this technique should work, assuming the messaging to the Facility Service is indeed the culprit, is that Facility Service records are cached locally until a change, any change is detected in the Facility Service database. If any such change is detected, the entire facility portion of the CygNetCache is discarded and re-retrieved when the next request for data occurs. The easiest way to update a Facility Service database record is to simply open any facility record in CygNet Explorer, click the “Edit” button and then click the “Save” button. You have now updated the timestamp of that record and the facility portion of the CygNetCache should now refresh. Repeating the process of closing CygNet Studio, editing a facility record and re-opening our screen in CygNet Studio should yield consistently poor screen load times. In our case, it absolutely does.
Background on CygNet database access
To refresh our memories, the messages we are sending to the Facility Service are an attempt to satisfy the Group Grid Control’s Reference Facility configuration expressed in the following SQL-ish (don’t try to run it, it still won’t work).
SELECT  ReferenceFacilityTag

FROM     RICKDEV.FAC

WHERE facility_info0 = ‘RICKDEV.UIS::GLWELL001’ AND

facility_table0 = ‘PROD’ AND

facility_type = ‘MTRRUNG’
As with most database technologies, CygNet database access via CygNet messaging tries to utilize the most efficient database indexes. The database indexes that exist on a CygNet database service can be viewed in CygNet Explorer by navigating to a CygNet database service (your Facility Service, for example) and selecting “Select Search…” from the right-click menu of the right-hand service view.
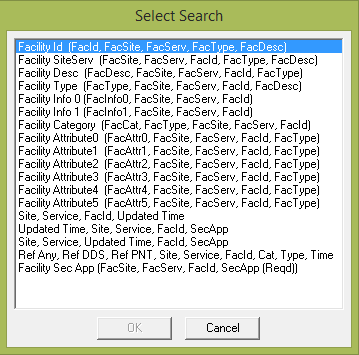-image7.png)
Listed above are the standard indexes provided for an out-of-the-box Facility Service. The best possible database index we could hope for is one that has all the database fields we are interested in (facility_info0, facility_table0, facility_type) combined into a single index along with the full facility tag of the reference facility. If such an index existed, the database query (expressed in CygNet messages) would be very concise and the results would be very efficiently returned. However, looking at the list of indexes, the best we can do are the indexes with descriptions that begins “Facility Info 0…” or “Facility Type…”. What we should expect, then, is the use of one of these two indexes and then a client-side process that filters down the records returned using the remaining constraints. The specific index chosen is not as important as the fact that, when a single database index is used to retrieve one of several requested attributes, a separate query (aka CygNet message) is issued for each row in the Group Grid. In our example, we have 500 Gas Lift Wells so that equates to 500 individual CygNet messages to submit 500 index requests. If every CygNet message takes 60 milliseconds round trip, that explains our 30 second screen load time. If only we could create a custom CygNet Facility Service index that meets our specific needs. Well, have I mentioned the CygNet feature that allows you to create custom database indexes?
Custom database indexes
Spoiler Alert! For those of you who can’t help but look in the back of the Algebra book for answers to odd numbered problems before trying it yourself, here’s the ultimate answer to this odd (numbered?) problem.
Step 1: Move your reference facility tag values from attribute facility_info0 (which is 50 characters long) to an available, 40 character facility attribute such as facility_attr3 to save 10 characters.
Step 2: Remove the term facility_type=MTRRUNG from your Reference Facility column configurations since, in our case, only facilities with facility_type=MTRRUNG have a facility_table0=PROD so the facility_type constraint is redundant.
Step 3: Create a new custom index for the Facility Service that contains the columns (FacTable0, FacAttr3, FacSite, FacServ, FacId). The summed length of all these attributes is now less than 100 and so they all fit within the length limit of a database index record.
The result of these changes is to reduce the number of CygNet messages required to retrieve the Production Gas Lift Meter Run reference facility tags for all 500 rows of our Gas Lift Well populated Group Grid Control down from 500 to 4.
Stay tuned…
If you would like to know more details about the process by which I arrived at this solution, tune back in for Part 2 and you just may develop the skills to solve all algebra problems of this kind, not just this one.
Share this entry