I improved this screen’s performance by 1000% and so can you! (part 2)
May 22, 2015 /
0 comments / in
General
/ by CygNet Blog Admin
In Part 1 of my mathematically inventive “1000% improvement” tale, I introduced you to some fundamental diagnostic techniques for evaluating the potential causes of slow CygNet Studio screen performance. Here in Part 2 of the continuing saga, we’ll dive into more details of the process by which we arrived at our Part 1 solution and introduce some useful tools for evaluating and understanding many CygNet message-based behaviors, not just this one example.
Resetting the scene
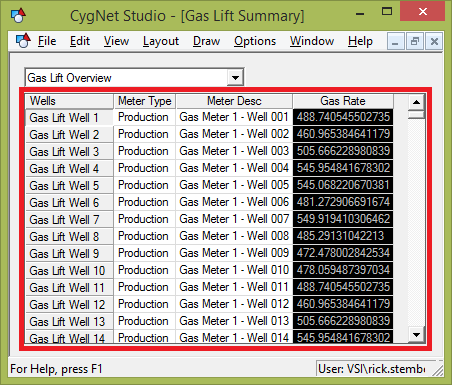
As you recall, the relevant elements of the customer’s Gas Lift Summary screen below are represented by a very common and straightforward set of CygNet Studio controls (see Part 1 for a more detailed explanation of the screen and facility configurations).
-image4.png)
The screen navigation is driven by a Group Navigation Bar pointing to a simple navigation hierarchy representing all wells using gas lift as their artificial lift technology. Beneath the Group Navigation Bar is a Group Grid control configured to display, as grid rows, the 500 Gas Lift Well facilities loaded by the Group Navigation Bar. The columns of the Group Grid are configured to display various facility attributes and point values, not from the Gas Lift Wells themselves but, instead, from each Gas Lift Well’s associated Production Gas Meter Run using the Reference Facility feature of the Group Grid.
The following is the equivalent search query expressed in my (patent pending) SQL-ish syntax which resolves the Group Grid’s Reference Facility configuration.
SELECT ReferenceFacilityTag

FROM   RICKDEV.FAC

WHERE  facility_info0 = ‘RICKDEV.UIS::GLWELL001’ AND

facility_table0 = ‘PROD’ AND

facility_type = ‘MTRRUNG’
The result is that each row of the Group Grid displays Meter Type, Meter Desc, and Gas Rate values from the well’s associated Production Gas Lift Meter.
And so we arrive back to the problem. If you add a pinch of network latency (ping times around 30 millisecond), this simple screen takes nearly 30 seconds to load.
Diagnostic guidelines revisited
I hope that your number one take away from my Part 1, “steps to diagnose poor screen performance” diatribe would be to always, always, always validate your assumptions. You may also have noticed that I played pretty fast and loose when evaluating the CygNet messaging issues in Part 1. Well, let’s fix that. The diagnostic process of Part 1 went something like this:
- The sample screen has 4 primary data retrieval tasks:
- Load the Group Navigation Bar
- Read Well facilities for the GroupGrid rows
- Resolve the Reference Facility configuration
- Retrieve real-time values to populate the grid cells
- A sample screen with just the Group Navigation Bar loads lickety-split
Conclusion: not the Group Navigation Bar
- A sample screen with both the Group Navigation Bar and the Group Grid Control without the Reference Facility column configuration, still loads very quickly.
Conclusion: not the simple Group Grid control
- Add the Group Grid columns with Reference Facility configurations and Yahtzee! Extreme slowness achieved.
Conclusion: must be the Reference Facility configuration
- Probably not the real-time value retrieval but not eliminated from contention.
So far, I would characterize the previous conclusions as suspicions supported by some indirect evidence but definitely not conclusive. How might we gather conclusive evidence? If only there were a way to capture, display and evaluate the actual CygNet messages sent and received.
Are those CygNet messages I smell?
So, just to recap, you are running the simplified CygNet Studio screen on an isolated client machine and consistently reproducing the poor performance? Excellent! Now, run the CygNet Message Sniffer utility. Oh, right. Maybe you’ve heard of Sniffer, you may have even run it under the watchful eye of a Support representative and then immediately deleted it from you system under threat of unspecified consequence. You may have also heard a certain, un-named CygNet employee claim at WESC that the Sniffer utility is now freely available but you have yet to receive promised satisfaction. Bottom line, you don’t have Sniffer to run. The good news is, a simplified version of Sniffer (SnifferLite) will be available near the end of May.
The Sniffer utility provides a very useful way of capturing and evaluating all the CygNet message traffic that is occurring on a particular machine. The most effective use of Sniffer, at least in our context here, is as follows:
- Start the capture of CygNet messaging traffic
- Reproduce the suspected messaging problems
- Stop the capture of messages
- Evaluate the captured messages themselves to support or dispute your assumptions
In all cases, you should only capture messages continuously with Sniffer for a relatively brief period of time (just a few minutes) since it stores all of the captured messages in memory and could quickly get itself into trouble.
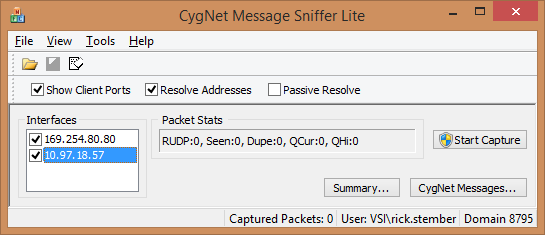
Without further ado, I present to you the main dialog of the CygNet Message Sniffer Lite and explain the features that matters to us.
-image21.png)
I won’t go into detail about all of the controls and features of Sniffer but one thing to verify is, if you have multiple network adapters on your machine, that you have them checked in the Interfaces list box. If you don’t check the appropriate Interfaces entry that represents the adapter over which CygNet messages are traveling, you won’t be able to capture a thing.
Click the Start Capture button to, you guessed it, start capturing which will also present the Packet Stats dialog.
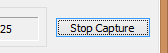
You should interpret the changing values under the RUDP section as a sign that messages are successfully being captured. Feel free to hide the Packet Stats dialog. Now that you are capturing messages, open your simplified CygNet Studio screen that demonstrates the slow loading time (control for the CygNetCache like we talked about), wait for it to load fully and then click the Stop Capture button to end the capture process.
-image41.png)
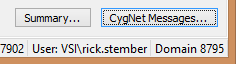
Message capture complete! To view the list of CygNet messages captured, click the CygNet Messages… button.
-image51.png)
As you can see, there are numerous and varied CygNet messages, each message represented by a row in the grid, to sort through.
-image61.png)
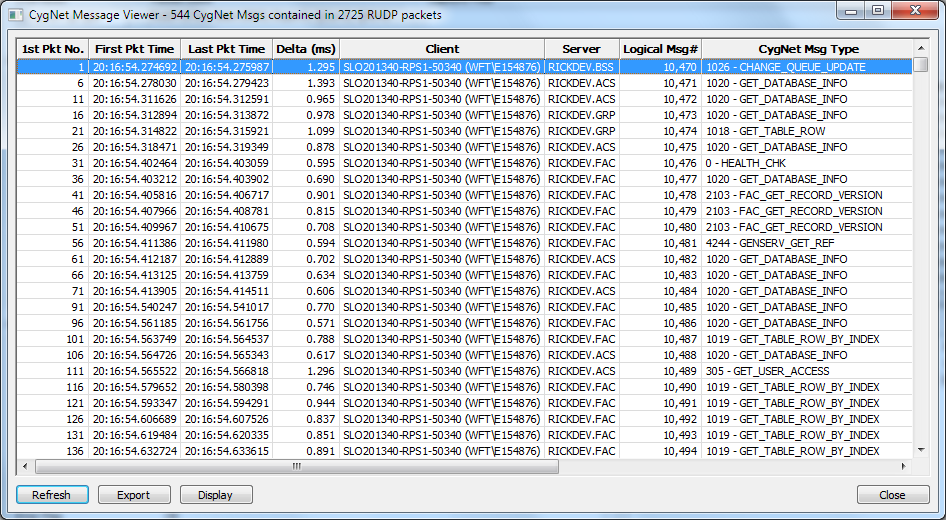
However, since our current suspicion is that CygNet messaging to the Facility Service is the source of our woes, let’s focus in on those messages specifically. Clicking on the column header named “Server” will sort the list by the CygNet service name to which the message was sent. Scrolling down to the Facility Service messages and looking in the “CygNet Msg Type” column, we see a smattering of “GET_RECORD_VERSION” and GET_DATABASE_INFO” but then a bunch of “GET_TABLE_ROW_BY_INDEX” messages.
-image71.png)
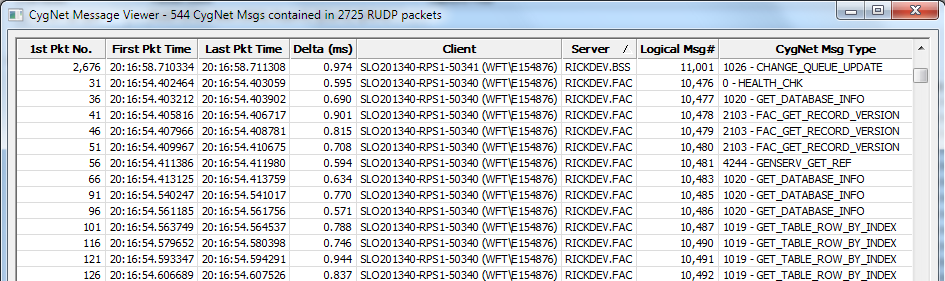
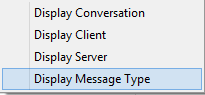
In order to isolate just those “GET_TABLE_ROW_BY_INDEX” message types, right-click on one of them and choose “Display Message Type” from the popup menu.
-image8.png)
Another CygNet Message Viewer window will open to display only the “GET_TABLE_ROW_BY_INDEX” messages.
-image9.png)
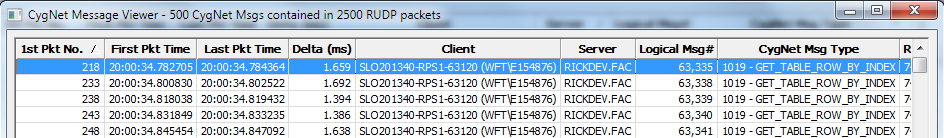
You see in the caption of the window that it contains 500 CygNet messages exactly. You should click the column heading named “1st Pkt No.” to make sure you are viewing the messages in the order they were sent. Then, if you calculate the time difference of the “First Pkt Time” entry for the first and the “Last Pkt Time” of the last row, you will know, conclusively, to the thousands of a millisecond, the amount of time it took to request and receive data via these 500 “GET_TABLE_ROW_BY_INDEX” messages.
As predicted in Part 1, we have 500 Gas Lift Wells so that should equate to 500 individual CygNet messages to submit 500 index requests. If every CygNet message takes 60 milliseconds round trip, that explains our 30 second screen load time.
Custom database indexes are your friend
As divulged last time, the optimal solution to our screen performance problems are as follows:
Step 1: Move your reference facility tag values from attribute facility_info0 (which is 50 characters long) to an available, 40 character facility attribute such as facility_attr3 to save 10 characters.
Step 2: Remove the term facility_type=MTRRUNG from your Reference Facility column configurations since, in our case, only facilities with facility_type=MTRRUNG have a facility_table0=PROD so the facility_type constraint is redundant.
Step 3: Create a new custom index for the Facility Service that contains the columns (FacTable0, FacAttr3, FacSite, FacServ, FacId). The summed length of all these attributes is now less than 100 and so they all fit within the length limit of a database index record.
The result of these changes is to reduce the number of CygNet messages required to retrieve the Production Gas Lift Meter Run reference facility tags for all 500 rows of our Gas Lift Well populated Group Grid Control down from 500 to 4.
All CygNet database services allow you to extend the table indexes to meet your specific needs. The definitions for your custom indexes are stored in the <SVCTYPE>APPL.DDL file (for example, the file is named FACAPPL.DDL for Facility services) which is located on the host machine in each service’s data directory. The custom index definition that satisfies our needs is the following:
DEFINE INDEX    ID=M2_INDEX,

NAME=FAC_M2_INDEX,

VERSION=1,

RECORD_ID_BYTE=52,

PREFIX=M2,

DESCR=”CygProd Index for Grids”,

ITEM=(fac_hdr.fac_grp.FAttr3),

ITEM=(fac_hdr.fac_grp.FacType),

ITEM=(fac_hdr.fac_grp.FacSite),

ITEM=(fac_hdr.fac_grp.FacServ),

ITEM=(fac_hdr.fac_grp.FacId);
When creating custom database indexes, I usually start with an existing index definition from, in our case, the FAC.DDL file, copy it to FACAPPL.DDL and customize it from there. You should modify the new index in the following way:
- Assign it a unique RECORD_ID_BYTE value, meaning one that has not already been assigned in the FAC.DDL.
- Assign it a unique 2 character PREFIX value.
- Change the portions of the ID and NAME attributes to match the chosen PREFIX value.
- Give it a meaningful DESCR value.
- Add the database columns to be indexed as ITEM entries observing the correct format, comma separation and semi-colon termination syntax. The correct database column names can be found as ITEMs of other indexes and at the top of the FAC.DDL file similar to “DEFINE ELEMENT ID=FAttr0…”.
Once you have what you think is a useful custom index definition, you will need to rebuild the database index file to include your new index definition. Perform the following steps to rebuild the index file:
- Save your custom database index definition to the appropriate *APPL.DDL file (e.g. FACAPPL.DDL).
- Stop your CygNet database service.
- Open a Command Prompt and navigate to your database service’s data directory (e.g. D:\CygNet\Services\FAC\).
- Run the ReIndexEse.exe utility from your CygNet Utilities directory by running a command similar to the following.
C:\CygNet\Utilites\ReIndexEse.exe
- Fix any errors in your custom index definition that may be reported and run the re-index until it succeeds. The utility should not take more than a few minutes to run at most.
- Restart your database service.
If all goes well, you should see your new custom index displayed in CygNet Explorer when choosing Select Search… from the right-click popup menu.
Crafting custom database indexes and validating goodness
Once again, I will leave you wanting more. Next time, we’ll walk through the design process for creating and validating well-crafted custom indexes with these new tools in your toolbox.
Share this entry