Related Posts
Canvas: A Re-introduction
02/23/2018
Canvas Beta Reminder
01/17/2017
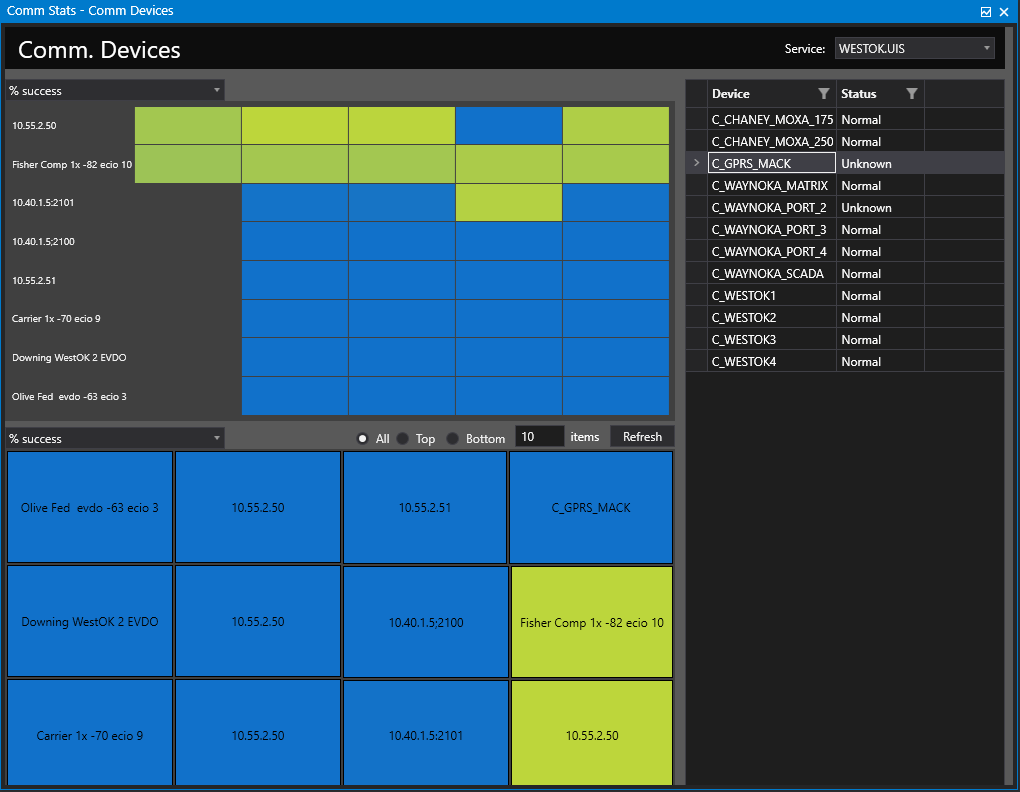
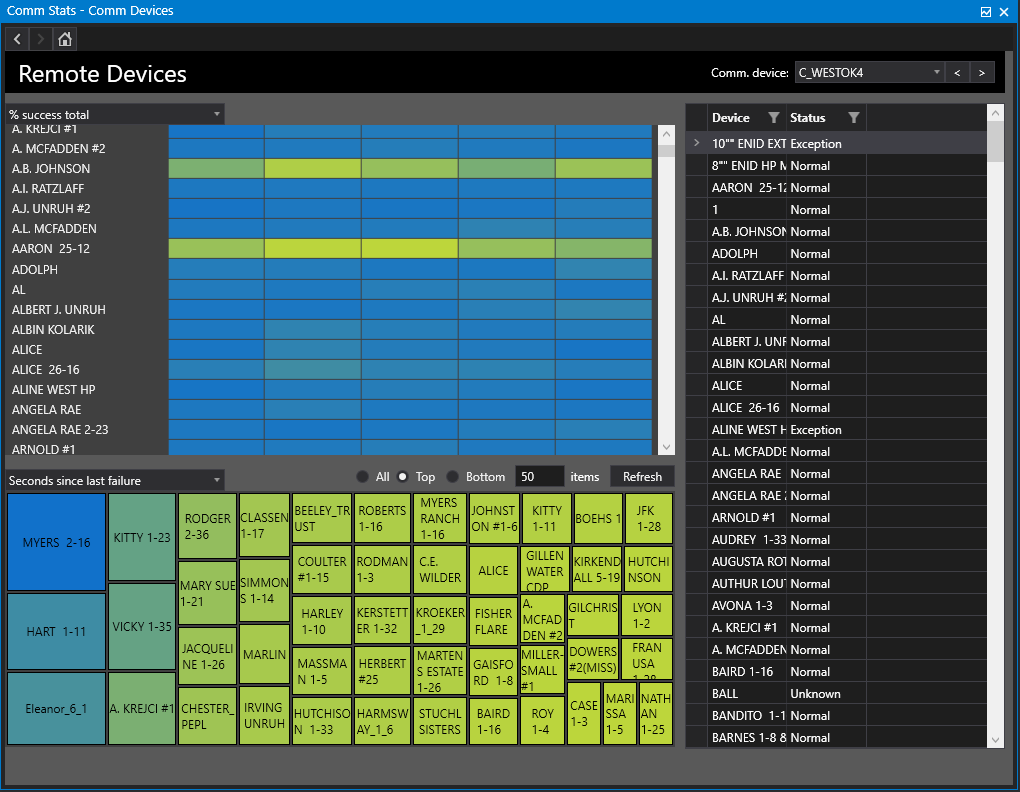
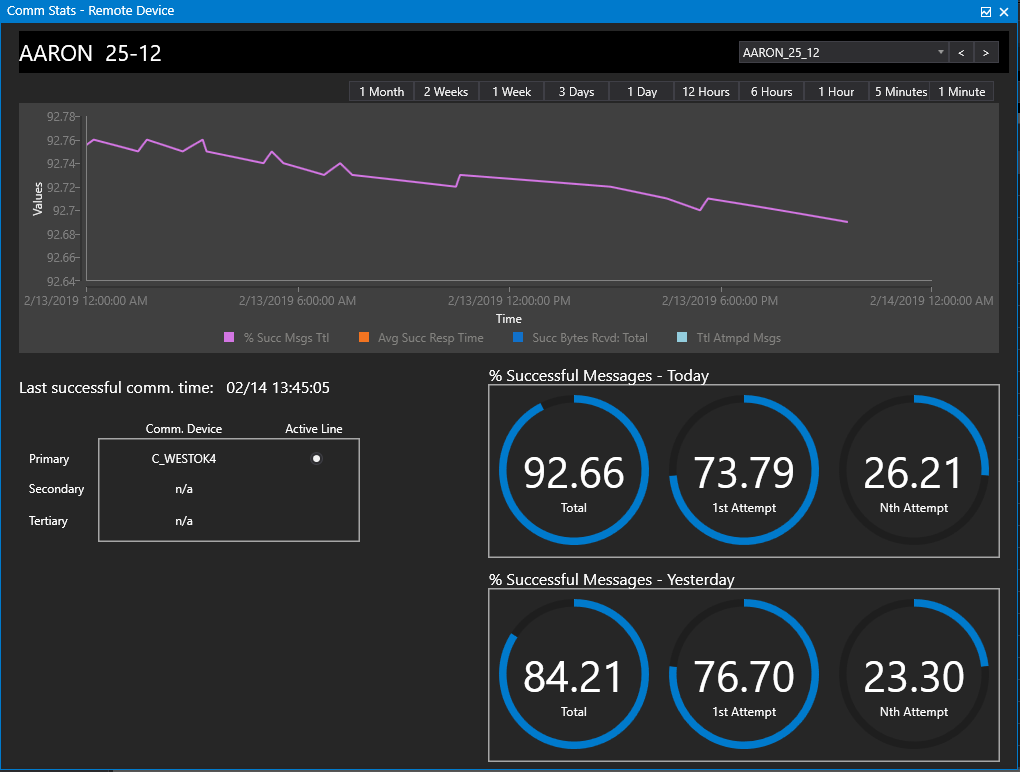
Analyzing Device Communications with CrcGenerator
11/09/2015
Canvas Feedback
04/26/2016
Canvas Introduction
05/03/2016
Canvas Beta
10/31/2016

|
Previous Post |
|
Newer Post |

|
Comments
| {{com.name}} {{com.blogCommentDateFormatted}} | |
Leave Comment
Please correct the following error(s):
- {{ error }}
Subscribe to this blog post
Enter your email address to subscribe to this post and receive notifications of new comments by email.