Canvas Preview: Grid
October 26, 2017 /
0 comments / in
General
/ by Luke Williams
If you’ve been using CygNet for even a little while you will have heard discussion and seen presentations about the next CygNet HMI, Canvas. With its impending official release this fall we continue this multi-part series by introducing you to some of Canvas’ new and exciting features.
The last post introduced you to the Chart, and showed an example of how the Tag Chooser can be used to easily drive its contents.
In this post we will introduce the Grid, and show another use case for the (soon to be) infamous Tag Chooser.
The Grid control supports the display of attributes, and current values from Facilities and/or Points, in a column and row layout.
One of the big improvements of the Canvas CygNet Grid over what was offered in Studio is that we’ve merged the Group Grid and the Generic Grid into one. You can populate the grid from CygNet (like the group grid) or from script (like the generic grid) or both.
In this post we’ll cover how to configure the Grid using the control configuration.
Configuration
The Grid can be configured within minutes to display a large variety of information from multiple Facilities and Points. The Grid is also aware of Relative Facilities, and Point information can now be displayed from disparate Facilities within the same Grid!
Do you want to create the Grid to display Well Detail information but also include a few columns from the linked Gas Meter? Not an issue, the Grid handles that through configuration in the UI with ease.
Grid configuration begins with defining columns. There are three column types, Generic, Facility, and Point.
The Generic Column can be populated using C# or VB.NET at run-time.
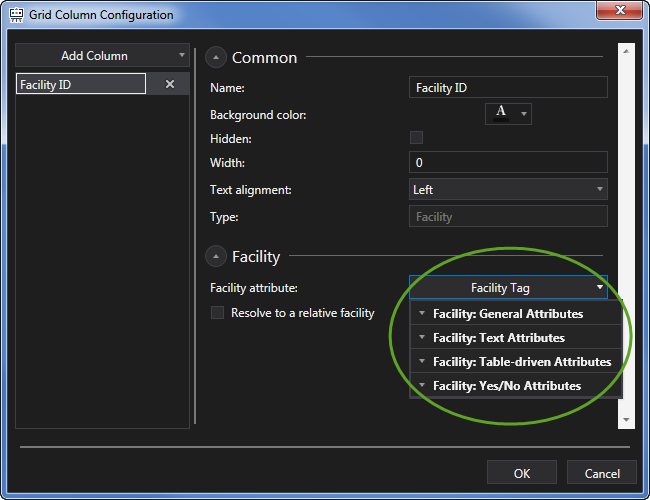
The Facility Column can display any configured Facility Attributes.
The Point Column can display current values or any Point Attributes.
To configure what attribute to display in a column, give the column header a unique name, and simply choose the desired attribute from the drop-down. Then selecting the Facility from the Tag Chooser in run-mode will populate the column with the selected attribute.
The Grid is also multi-facility aware, and depending on which level of a configured hierarchy selected (from the Tag Chooser) will depend on how many rows will be loaded into the Grid.
Dynamically Populating a Column
In the example above, navigating down from Area, to Route, yields a list of Facilities. Clicking on a single Facility loads its Facility Tag (in this example) into the configured column. Navigating higher up the hierarchy, to the Route or to the Area levels shows all of the Facilities that share those Attributes at each level. This makes the workflow of moving ‘up’ and ‘down’ inside of a Grid very efficient.
To configure multiple columns, simply repeat the column adding process for any of the current values or attributes that you want to display.
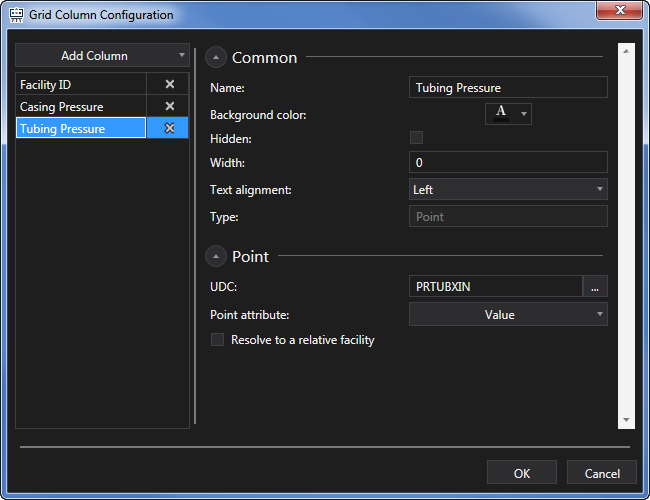
These three column configurations simply provide a column header name, a UDC, and Point attribute. This configuration results in the speedy and robust display of all Casing and Tubing Pressures for any number of selected Wells.
Grid Well Points
Relative Facilities
In the example above the Grid is configured to display Casing and Tubing pressure from the selected Well Facilities. What if I want to also include in this same grid the pressure from the linked Gas Meter?
In the past this might require a separate grid to take the Facility from the navigation bar and find the linked facility attribute and then populate another grid with the needed values, or maybe statically assigning some UDCs to some text tools. Needless to say it was a bit more complex than what the is required now in Canvas Grid.
Using the new Canvas Relative Facility configuration, Grids can easily display values or attributes from any configured linked facility attributes. To include data from a linked facility, add the UDC, and simply select the Relative Facility attribute to be used, that’s it.
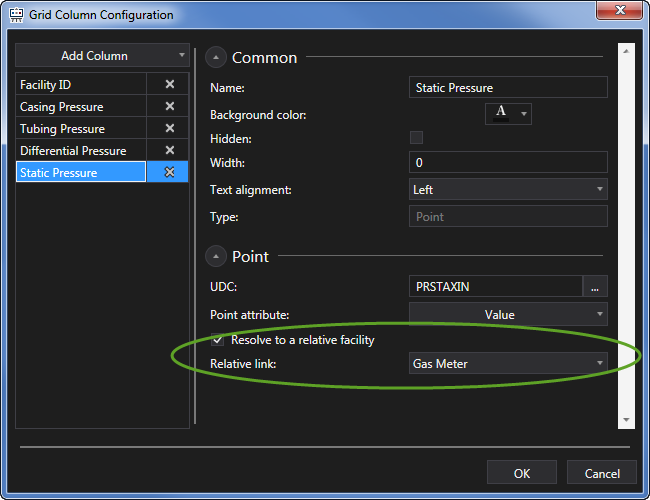
To explain a little more about what’s happening here…the Well Facility is set in the Tag Chooser, the Grid displays any values or attributes associated with the Well Facility for any of the configured columns. For the Differential and Static pressures, those values are coming from the linked Gas Meter, and by setting the Gas Meter as the ‘relative link’ Canvas knows how to go find the points on the linked device and which UDC/Facility combination to include in the Grid. It doesn’t get much easier than that!
Grid - Relative Points
Additional Features
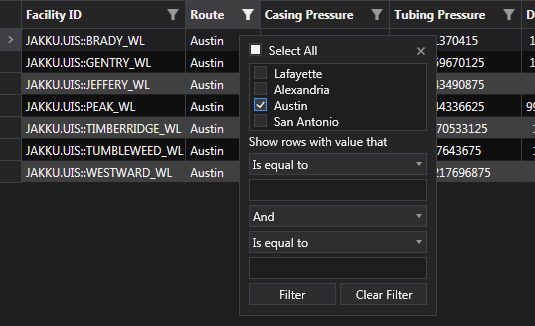
How about having the ability to filter columns to only display unique values, or exclude others? Do this on-the-fly, and it won’t affect the Grid layout, Tag Chooser hierarchies or cached results.
Single or multi select grids, cells, or rows, copy and paste right into Excel, Notepad, or other application.
The Grid brings a sense of performance and style to screens that once you start using will make it hard to look for anything else.
Next post we’ll get into the Text Tool and how it can be used in conjunction with some of the controls we’ve covered so far.
Share this entry